
 Black Steel Doors
 Woodstock Campers
 Phillips Joinery
TL;DR:
- Many brands focus on superficial marketing metrics that fail to increase revenue because they neglect proper data interpretation and attribution methods. To drive real growth, companies must establish solid analytical infrastructure, segment data effectively, and utilise multiple attribution models alongside incrementality testing. Continuous analysis, testing, and disciplined implementation of insights are essential for sustainable digital marketing success.
Marketing results that look great on the surface but fail to shift the numbers on actual revenue is one of the most common frustrations facing ambitious brands today. You’re pulling reports, checking dashboards, watching sessions climb, and yet the growth you expected simply isn’t materialising. The problem is rarely the data itself. It’s the way that data is being read, attributed, and acted upon. This guide walks you through a structured, practical framework for turning raw marketing numbers into decisions that drive digital growth, from setting up your tools correctly to choosing the right attribution model and validating every major strategic shift.
Key Takeaways
| Point | Details |
|---|---|
| Prepare with the right tools | Gather reliable data sources and ensure you know which metrics align with your goals before starting analysis. |
| Avoid single-model traps | Comparing attribution models helps prevent bias and reveals the true value of your marketing channels. |
| Follow a structured analysis process | Break down your workflow into staged steps for transparency and actionable insights. |
| Action insights with strategic tests | Turn findings into growth by validating major changes with experiments that prove what really works. |
What you need before starting your analysis
Before you can interpret a single metric meaningfully, you need the right infrastructure in place. Too many marketing teams jump straight into reports without confirming that their data is complete, consistent, and correctly configured. This leads to decisions built on shaky foundations.
Core tools for marketing analysis
The starting point is access. You need direct access to the platforms generating your data, not just summary emails or agency-curated dashboards. The most important tools for most brands include:
- Google Analytics 4 for website traffic, user journeys, and attribution modelling
- Meta Ads Manager for paid social performance, reach, frequency, and conversion data
- Google Ads for search and display performance, quality scores, and cost metrics
- A spreadsheet tool such as Google Sheets or Microsoft Excel for consolidating cross-channel data
- A CRM platform such as HubSpot or Salesforce for linking marketing activity to actual revenue
Each of these tools captures a different slice of your marketing performance. None of them, on its own, gives you the complete picture. Connecting them is where the real analytical work begins, and it’s the foundation of sound data-driven marketing.
Essential metrics to have ready
Before diving into trends or channel comparisons, confirm you have clean data for these core metrics:
| Metric | Why it matters | Primary tool |
|---|---|---|
| Sessions and traffic sources | Shows where visitors come from | Google Analytics 4 |
| Conversion rate by channel | Reveals which sources drive action | Google Analytics 4 / CRM |
| Return on ad spend (ROAS) | Measures paid media efficiency | Google Ads / Meta Ads |
| Cost per acquisition (CPA) | Tracks the true cost of each customer | All ad platforms |
| Attribution model comparison | Shows credit distribution across touchpoints | Google Analytics 4 |
| Customer lifetime value (CLV) | Contextualises short-term campaign ROI | CRM |
The table above also underscores an important discipline: knowing which tool to trust for which metric. Using Meta Ads Manager to assess your overall ROAS, for instance, will almost always produce an inflated figure because it counts conversions that other platforms also claim credit for. Cross-platform reconciliation is not optional; it is essential.
A solid grasp of these fundamentals is covered in detail in our digital marketing guide, which is worth revisiting before you run your first formal analysis.
Pro Tip: Always define your KPIs in terms of final business outcomes, not just marketing metrics, before you begin any analysis. Revenue, margin, and customer acquisition cost should anchor every conversation about what “good” performance looks like.
One critical foundation to address early is your attribution setup. As Google Analytics Help notes, relying on last-click or a single attribution lens can cause you to mis-value awareness and assist channels. Comparing multiple attribution models, and where possible validating with incrementality testing, helps prevent this costly miscalculation from the start.
Step-by-step process to analyse your marketing results
With your tools and metrics in place, you can move into the actual analysis. The goal here is not to produce a beautiful report. It’s to surface insights that change how you allocate budget, prioritise creative, and test new channels. Here is the five-step process we recommend for thorough, repeatable marketing analysis.
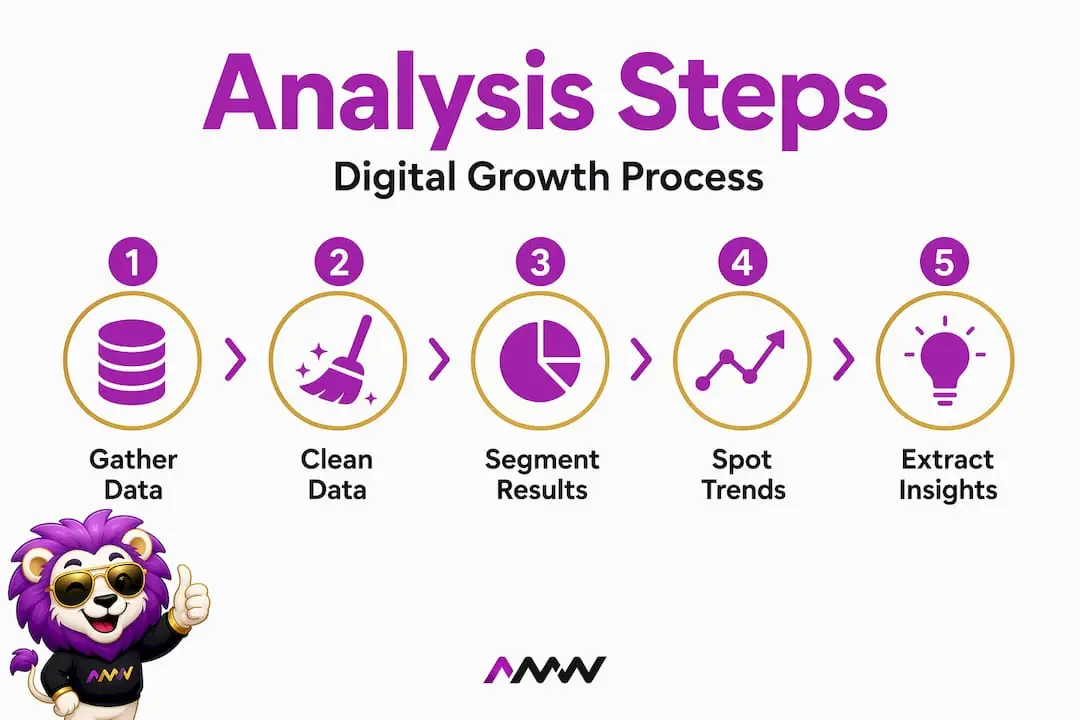
Step 1: Gather your raw data
Pull data directly from each platform for a consistent time period. Whether you choose a weekly, monthly, or quarterly cycle, the window must be identical across every source. Inconsistent date ranges are one of the most common causes of misleading comparisons. Export raw data files rather than relying solely on dashboard summaries. Dashboards are useful for quick checks, but they often apply default filters or attribution settings that can obscure what’s really happening.
Step 2: Clean your data
Raw data is almost never clean. Duplicate transactions, bot traffic, tracking errors, and UTM parameter inconsistencies all corrupt your analysis. Spend time removing obvious anomalies, standardising naming conventions across campaigns, and checking for gaps in tracking. If a specific date shows a sudden, unexplained spike or drop, investigate it before including it in your analysis. Unexplained anomalies that make it into your conclusions can send your strategy in entirely the wrong direction.

Step 3: Segment by channel and campaign
Aggregate data tells you very little. The insights come from segmentation. Break your results down by channel (paid search, paid social, organic search, email, direct), then by campaign, and where possible by audience segment or creative variant. This level of granularity reveals which specific combinations of channel, message, and audience are driving your best outcomes. It also highlights underperforming segments that may be dragging down your overall averages without being visible at the top level.
Step 4: Identify trends and anomalies
With clean, segmented data, look for patterns over time rather than point-in-time snapshots. A channel that performed poorly last week might be showing a consistent upward trend over the past six weeks. Conversely, a channel that looks strong in isolation may be plateauing or cannibalising results from another source. Anomalies deserve particular attention. A sudden drop in conversion rate on a landing page, for instance, might indicate a technical issue, a change in audience quality, or a creative that has simply stopped resonating. The process of driving ROI with analytics depends heavily on this kind of systematic trend identification.
Step 5: Extract insights and align with objectives
The final step is translating observations into recommendations. For every trend or anomaly you identify, ask: what does this mean for the business, and what should we do differently? This is where analysis becomes strategy. Each insight should link directly back to a business objective. If your goal is to reduce CPA by 20%, every recommendation should either reduce cost, improve conversion rate, or both. A structured creative campaign process that feeds insights back into creative development ensures your analysis actually influences what gets built next.
Pro Tip: Export raw data from every platform at least once a month and store it in a shared folder or data warehouse. Platforms frequently restate historical data as attribution windows close, meaning the numbers you see today may look different in 30 days.
“If you rely only on last-click or a single attribution lens, you can mis-value awareness and assist channels.” Comparing models and, where possible, validating with incrementality testing is the safeguard every ambitious brand needs.
Evaluating attribution models and their impact
Attribution is arguably the most misunderstood aspect of marketing analysis. The model you choose to assign credit for conversions fundamentally changes what your data appears to say. Two brands running identical campaigns can reach completely opposite conclusions about channel effectiveness based solely on which attribution model they use.
Understanding the main attribution models
Here is a plain-language overview of the models you’re most likely to encounter:
Last-click attribution gives 100% of the conversion credit to the final touchpoint before a purchase. It’s simple and easy to understand, but it systematically undervalues all earlier interactions in the customer journey.
First-click attribution does the opposite, assigning all credit to the very first touchpoint. This is useful for understanding where awareness originates, but it ignores everything that happens afterwards.
Linear attribution spreads credit equally across every touchpoint. It’s more balanced, but it treats a brand awareness impression and a high-intent product page visit as equally valuable, which is rarely accurate.
Data-driven attribution uses machine learning to assign credit based on the actual contribution each touchpoint makes to conversions. It’s the most sophisticated model, but it requires significant data volume to produce reliable results.
Comparing attribution models on a sample customer journey
Consider a customer who first discovers your brand through a YouTube pre-roll ad, then clicks a Facebook retargeting ad three days later, searches for your brand name on Google, and finally converts through a Google Shopping ad. Here is how credit would be assigned under each model:
| Attribution model | YouTube ad | Facebook retargeting | Google brand search | Google Shopping |
|---|---|---|---|---|
| Last-click | 0% | 0% | 0% | 100% |
| First-click | 100% | 0% | 0% | 0% |
| Linear | 25% | 25% | 25% | 25% |
| Data-driven | 15% | 30% | 20% | 35% |
The practical implication here is enormous. A brand using last-click attribution would cut their YouTube budget, concluding it drives no conversions. A brand using data-driven attribution would see that YouTube contributed meaningfully to the path and would likely maintain or increase investment. Same data, completely different strategic outcome.
Common pitfalls of model misapplication
- Over-investing in last-click channels while underfunding awareness activity that is silently driving demand
- Comparing performance across platforms using each platform’s native attribution, which always favours that platform
- Treating ROAS as absolute truth without accounting for incrementality or overlap between channels
- Ignoring assist channels that consistently appear in multi-touch paths but never receive last-click credit
As Google’s marketing measurement guidance makes clear, attribution is best used for path-level optimisation, while incrementality testing is the right tool for budget-level causality decisions. Reconciling both, rather than trusting either in isolation, gives you a far more accurate picture of true channel value.
For a deeper look at how attribution choices feed into broader optimising digital strategy decisions, it’s worth considering how each model change might alter your quarterly budget allocations before committing to a single approach.
Turning analysis into ROI: Interpreting and acting on insights
Analysis without action is just reporting. The real value of marketing analysis lies in what you do with the insights it surfaces. Here is a structured approach to turning findings into decisions that generate measurable returns.
Four ways to act on your findings
Reallocate budget towards higher-performing channels. Once your attribution and incrementality data gives you a clearer view of true channel contribution, shift spend towards the channels and audiences with the lowest CPA and highest incrementality. Even a 10% reallocation from a low-performing channel to a proven one can produce a material improvement in overall campaign ROI.
Refine your creative based on performance patterns. Analysis often reveals that performance variance between campaigns is driven less by channel selection and more by creative quality. If one ad consistently outperforms others in click-through rate but underperforms in post-click conversion, the issue may lie in message continuity between the ad and the landing page rather than the ad itself.
Test new channels using controlled experiments. If your analysis suggests an untapped audience segment or an underexplored channel, don’t simply add it to the media plan and wait. Design a structured test with a defined success metric, a clear control group, and a predetermined evaluation period. This is how you separate genuine opportunity from confirmation bias.
Run A/B experiments before scaling major changes. A sudden jump in budget to a new audience or format should always be preceded by a smaller-scale test. The same applies to landing page redesigns, new offer structures, and bidding strategy changes. As the Marketing Experimentation & Incrementality Testing framework from Google highlights, using attribution for path-level decisions and incrementality for budget-level ones, whilst reconciling the two rather than relying on a single metric such as ROAS, is what separates disciplined growth from lucky guesswork.
Linking your analysis findings to ongoing campaign evolution is where marketing analytics and ROI compounding starts to happen. Each cycle of analysis, experimentation, and refinement builds on the last, creating a progressively sharper understanding of what works for your specific brand, audience, and market.
Pro Tip: Before making any significant budget or strategy shift based on analysis alone, design a structured test to validate your hypothesis. Correlation in your data does not confirm causation. A controlled experiment is the only way to be certain that a change in performance was caused by a specific variable.
What most brands get wrong when analysing marketing results
Here’s an uncomfortable observation from working with ambitious brands across industries: most marketing analysis is not actually analysis. It’s storytelling in reverse. Teams look at the numbers, find the metrics that confirm what they already believed, build a narrative around those data points, and present it as insight. The real patterns, the ones that could actually change how budget is allocated or how creative is developed, go unnoticed because nobody was looking for them.
The biggest single mistake is treating attribution and incrementality as competing frameworks, as though you have to choose one or the other. Attribution tells you how customers travelled to conversion. Incrementality tells you whether your marketing actually caused that conversion or whether it would have happened anyway. They answer fundamentally different questions, and the brands that use both together consistently make better budget decisions than those relying on either alone.
There’s also the dashboard dependency problem. When your primary analytical tool is a pre-built dashboard, your analysis is constrained by whoever designed that dashboard and whatever filters they applied. Dashboards are built for convenience, not for discovery. The most revealing insights typically emerge from raw data exploration, not from reading a summary someone else configured.
Vanity metrics are another trap. Impressions, reach, follower counts, and email open rates are useful contextual signals, but they are not performance indicators. If a metric doesn’t have a clear, traceable relationship to revenue or customer acquisition, it belongs in the appendix of your report, not the headline. Letting vanity metrics dominate the analysis conversation creates a false sense of progress that can mask serious underperformance in the metrics that actually matter.
Perhaps the most overlooked mistake, though, is treating marketing analysis as a one-off activity rather than a cyclical, hypothesis-driven process. Analysis is only useful if it generates a testable hypothesis, if that hypothesis is tested with rigour, and if the results feed back into the next round of analysis. The brands that treat this as a continuous loop, rather than a quarterly exercise in justifying what was already spent, are the ones that compound their learning fastest. A structured approach to digital strategy optimisation embeds this kind of cyclical discipline into the way the entire marketing function operates.
Rethinking analysis as a system of ongoing hypotheses and experiments, rather than a retrospective justification exercise, is one of the most impactful mindset shifts a marketing team can make.
How AMW Media helps brands master marketing analysis
Understanding your marketing data is one thing. Building the systems, creative output, and strategic frameworks to act on it at pace is another challenge entirely. If your business is in Berkshire and you want a team to run this, our Reading page sets out how we work, with the numbers attached.
At AMW Media, we work with ambitious brands to bridge exactly that gap. Our multi-channel expertise spans social media management, SEO specialists, and PPC campaign management, meaning we can connect attribution insights directly to the channels and creative assets driving your results. We don’t just report on what happened. We build the analytical infrastructure, run structured experiments, and translate findings into the strategic shifts that move your numbers in the right direction. If your marketing results are generating data but not decisions, we’d welcome the opportunity to review your current setup and show you what a more disciplined analytical approach could achieve for your brand.
Frequently asked questions
What is the biggest mistake when analysing marketing results?
Relying solely on one attribution model, such as last-click, can skew your decisions and undervalue vital channels, as single attribution models consistently mis-value awareness and assist touchpoints.
How often should I review my marketing data for best results?
Review your core metrics and analysis weekly, but assess model changes and attribution shifts monthly for the best strategic insights. Quarterly deep-dives into incrementality and budget allocation should also be part of your planning rhythm.
What’s the most important metric to focus on?
No single metric tells the full story. Use attribution for path-level optimisation and incrementality for true ROI and budget-level causality decisions, reconciling both rather than treating either as absolute truth.
How do you measure incrementality in digital campaigns?
Run controlled experiments, such as A/B tests or geo-based holdout tests, to determine what incremental value channels contribute beyond baseline performance that would have occurred without your marketing activity.
Recommended
- How to optimise digital strategy for marketing success
- Understanding digital marketing: strategies for business growth
- Key benefits of digital marketing for brand growth | AMW Media
- How to master your digital marketing process for 2026
Our free marketing audit looks at your site, your ads and your content, and comes back with a 30 day plan. No pitch deck.

Runs the content calendars and the community side of every social account, and keeps clients posted on what is going out and when. Meet the team.