
 Black Steel Doors
 Woodstock Campers
 Phillips Joinery
Customer journey mapping is the process of visualising every step a customer takes with your brand, from first hearing about you to becoming a loyal advocate, so you can see exactly where the experience breaks down and where it delights. Start today by picking one high-friction journey, writing a single objective for it, and booking a 90-minute workshop with the people who own each stage.
Every useful map captures the same core elements:
- Stages: the broad phases of the journey (typically five to seven, from awareness through to advocacy)
- Touchpoints: every moment the customer interacts with your brand, online or offline
- Customer actions: what they actually do at each step
- Emotions and pain points: how they feel and where frustration peaks
- Metrics and owners: the numbers that signal success and the person responsible for each stage
Key takeaways
A well-built customer journey map, grounded in real customer data and tied to a specific business objective, is one of the most direct ways to identify and fix the friction that costs you conversions, retention, and revenue.
| Point | Details |
|---|---|
| Start with one journey | Pick the highest-friction journey and write a single measurable objective before doing anything else. |
| Use five to seven stages | Structure your map around awareness, consideration, decision, retention, and advocacy for strategic clarity. |
| Mix qual and quant evidence | Combine customer interviews with analytics data so emotion claims are backed by behavioural evidence. |
| Assign owners before you leave the room | Every prioritised fix needs a named owner and a deadline, or the map will not drive change. |
| AMW Media for implementation | AMW Media runs research sprints, synthesis workshops, and implements fixes across web, PPC, SEO, and automation for UK brands. |
What is customer journey mapping, and which type do you need?
A customer journey map is a structured visual document that tells the story of a customer’s experience from their perspective, not yours. That distinction matters more than it sounds. Most internal process maps describe what your teams do. A journey map describes what the customer does, thinks, and feels at every stage, which is why journey maps are distinct from process maps: the defining feature is the customer-centred lens, layering emotions and pain points alongside actions.
There are four formats teams commonly reach for, and choosing the wrong one wastes weeks:
- Current-state map: documents the journey as it exists today, warts and all. Use this when you need to diagnose friction, align teams on a shared reality, or build a business case for investment.
- Future-state map: shows the ideal experience you want to create. Use it for product launches, service redesigns, or when you need to rally stakeholders around a vision.
- Day-in-the-life map: zooms out beyond your brand to show the customer’s full day or week, revealing context your touchpoints sit inside. Particularly useful for B2B SaaS teams trying to understand where their tool fits into a busy buyer’s workflow.
- Service blueprint: extends the journey map backstage, mapping the internal processes, systems, and people that support each customer-facing moment. Use this for operational redesign or when fixing a problem requires cross-departmental change.
A quick illustration of each in practice: a UK fashion retailer might run a current-state map to find out why checkout abandonment spikes on mobile. A B2B SaaS company might build a day-in-the-life map to understand why their onboarding emails land at the wrong moment in a procurement manager’s week. A GP surgery redesigning its referral process would likely need a service blueprint to surface the internal handoffs that slow patient care.
Why bother? The real business case for mapping customer journeys
The honest answer is that most organisations already have customer data. What they lack is a shared view of what that data means across teams. Journey mapping drives better data governance by forcing marketing, sales, and service teams to align on customer definitions and identify where touchpoint data is missing or contradictory.
Beyond governance, the direct business outcomes are worth naming plainly:
- Reduced friction: mapping surfaces the specific steps where customers drop off, so you fix the right thing rather than guessing
- Improved conversion: understanding the decision stage in detail reveals which objections go unaddressed and which content is missing
- Shorter sales cycles: B2B teams that map the buying group’s journey often find they are nurturing the wrong stakeholder at the wrong time
- Higher retention: post-purchase and onboarding maps consistently expose the moments that drive early churn, which are usually fixable
- Cross-functional alignment: a shared map replaces the endless “whose problem is this?” conversation with a clear owner for each stage
A typical customer journey map is structured around five core stages: awareness, consideration, decision, retention, and advocacy, and most practical maps use five to seven stages in total. That structure matters because it forces teams to think about the full arc of the relationship, not just the acquisition funnel they already measure.
The organisational benefit that tends to surprise people most is alignment. When a head of marketing, a customer success lead, and a product manager sit in the same room looking at the same map, disagreements about priorities tend to resolve faster than in any strategy meeting.
What does a good journey map actually contain?
Journey maps should capture touchpoints, customer actions, emotions, channels, and ownership, and teams commonly map both current and future states depending on the objective. Here is the canonical checklist of fields to include, and why each earns its place.
Essential components
- Stages (5 to 7 for strategic maps, 8+ for operational): the high-level phases that structure the map. Keep them customer-facing (“I discover”, “I evaluate”, “I buy”) rather than internal (“lead generation”, “pipeline”).
- Steps within each stage: the specific actions a customer takes. A consideration stage might contain three to five steps: reading a review, comparing pricing pages, watching a demo.
- Touchpoints: every interaction point, whether that is a Google ad, a sales call, a confirmation email, or a packaging insert.
- Channels: where the touchpoint happens (search, social, email, in-store, phone). Mapping channels separately from touchpoints reveals where you are over-relying on one channel.
- Customer actions: what the customer literally does at each step, written in first-person (“I search for reviews”, “I request a demo”).
- Emotions and sentiment: how the customer feels, ideally backed by interview quotes or CSAT data rather than assumption.
- Pain points: the specific frustrations, blockers, and moments of confusion that reduce the chance of moving to the next stage.
- Moments of truth: the two or three interactions that disproportionately shape the overall perception of your brand.
- Metrics: the quantitative signals that tell you how well each stage is performing (traffic, time on page, conversion rate, churn rate, NPS).
- Owners: the team or individual responsible for each stage. Without this, maps become wallpaper.
- Desired outcomes: what the customer wants to achieve at each stage, and what your business needs to happen.
Choosing the right level of detail
For a strategic map used to align leadership, five to seven stages with one or two rows of data per stage is usually enough. For an operational map used to redesign a specific process, eight or more stages with granular step-level data gives teams the specificity to act. The rule of thumb: if the map is for a boardroom, keep it lean. If it is for a product or service team, go deep.
| Component | Qualitative inputs | Quantitative inputs |
|---|---|---|
| Emotions and pain points | Customer interviews, support tickets, session recordings | CSAT scores, sentiment analysis |
| Touchpoints and channels | Stakeholder workshops, customer surveys | Analytics, CRM data, attribution reports |
| Conversion and drop-off | Usability testing, exit surveys | Funnel data, A/B test results |
| Moments of truth | In-depth interviews, focus groups | NPS by touchpoint, review analysis |
How to create a customer journey map: a step-by-step process
Effective mapping follows a systematic process: define objectives, create personas from real data, identify touchpoints, map stages, capture emotions, and translate findings into actions. The whole process, from scoping to a first usable map, typically takes two to six weeks for a research-backed map. Here is how to run it.
Step 1: Set your objective and scope
Write one sentence: “We are mapping the [journey name] for [persona] to [business objective].” For example: “We are mapping the onboarding journey for new SME clients to reduce 30-day churn.” That sentence governs every decision that follows. Choosing which journey to map based on business pain and cross-team impact is the single most important scoping decision you will make.
Step 2: Pick one persona
Resist the urge to map all personas at once. Depth beats breadth for initial impact. Build or select one persona grounded in real research: job title, goals, frustrations, preferred channels, and decision-making context. For practical guidance on constructing personas from marketing data, building target personas from campaign signals is a useful starting point.
Step 3: Gather your inputs
Mix qualitative and quantitative evidence so emotion claims can be triangulated with behaviour. Useful sources include:
- Customer interviews (aim for at least five to eight for qualitative saturation on a single journey)
- Support tickets and live chat logs
- Session recordings and heatmaps
- Analytics funnels and drop-off data
- NPS and CSAT verbatims
- Sales call recordings
Step 4: Map stages and touchpoints
Draft the stages first, then populate touchpoints within each. Use sticky notes or a digital whiteboard so the team can move things around. Keep stage names in the customer’s voice.
Step 5: Add emotions and evidence
For each touchpoint, record how the customer feels and back it with a quote or a data point.
Step 6: Identify opportunities and score them
List every pain point and gap the map reveals. Score each one on a simple impact-versus-effort matrix: high impact, low effort fixes go first. This prevents the map from generating a 40-item backlog that nobody prioritises.
Step 7: Assign owners and create an action plan
Each prioritised fix needs a named owner, a deadline, and a success metric. Without this step, maps risk becoming shelfware. A map with three owned, time-bound actions is worth more than a beautiful 12-stage document with no next steps.
Step 8: Visualise, socialise, and schedule reviews
Present the map in the format that fits your audience: a slide deck for leadership, a Miro board for working teams. Schedule a quarterly review to update the map as the product and market evolve. Salesforce recommends a concise checklist that mirrors this approach: set scope, build personas, outline touchpoints, and prioritise improvements.
Pro Tip: Run the workshop with a mix of roles: someone from marketing, someone from customer success or support, and someone from product or operations. The most revealing moments in any mapping session come when the support person says “customers call us about that every week” and the marketing person says “we had no idea.”
How long does it take, and what does it cost in the UK?
Timeline and cost vary significantly depending on scope, research depth, and whether you are doing this in-house or with an agency. Here are realistic ranges for UK teams.
- Assumption-based workshop map (2 to 4 hours): No primary research. A cross-functional team maps what they believe the journey looks like, then flags assumptions to validate later. Cost: internal time only, typically £500 to £1,500 in facilitation if you bring in external help.
- Lightweight research-based map (2 to 6 weeks): Five to eight customer interviews, analytics review, and a half-day workshop to synthesise findings. Cost: £3,000 to £8,000 with an agency, or significant internal time if done in-house.
- Enterprise-scale mapping (8 to 12+ weeks): Multiple personas, multi-channel research, service blueprint, and integration with CX platforms. Cost: £15,000 to £40,000+ depending on scope and the number of journeys covered.
What drives cost upward: the number of personas, the depth of primary research, the complexity of the visualisation, and whether the output needs to integrate with a CX platform or analytics stack.
A practical way to phase the work: run an assumption-based workshop in week one to get alignment and surface the biggest unknowns, then use weeks two to four to validate the highest-risk assumptions with real customer data. This approach shows early wins to stakeholders while building toward a research-grounded map.
Our prices are on the website, not behind a form. The rate card starts at £99 for a logo and reaches £4,999 for an ecommerce build, and you can total up your own shortlist on the page.
Templates and examples you can use straight away
A template is only useful if it matches the job you are trying to do. Here are three formats worth keeping in your toolkit, along with the situations where each one earns its keep.
Strategic 5 to 7 stage map (slide or PDF format): One row per component (stages, touchpoints, emotions, metrics, owners) across five to seven columns. Best for leadership alignment, annual planning, or briefing an agency. Use it when you need a shared view of the full journey without getting lost in operational detail. Download a free version from Miro’s template library or Lucidchart’s template gallery and adapt the stage names to your business.
Operational deep-dive map (Miro board or Lucidchart): Eight or more stages with step-level granularity, multiple data rows, and space for verbatim quotes. Best for redesigning a specific process, such as a checkout flow or an onboarding sequence. A UK e-commerce brand used this format to identify that their checkout abandonment spike happened specifically at the delivery options step, not at payment, which redirected three months of development effort.
Empathy “day-in-the-life” map (whiteboard or slide): A single horizontal timeline showing the customer’s full day, with your brand’s touchpoints marked as moments within it. Best for building empathy across teams or for B2B contexts where your product is one of many tools a buyer uses. Particularly effective when combined with storytelling in marketing techniques to make the customer’s reality vivid for stakeholders who rarely speak to customers directly.
Journey maps combine storytelling and visualisation to make customer needs visible across teams, which is why the format you choose for presenting the map matters almost as much as the content inside it.
Which tools work best for journey mapping in the UK?
Tool choice comes down to one question: do you need speed and collaboration, or depth and data integration? Here is a practical breakdown by category.
Whiteboard and collaboration tools (Miro, FigJam, Microsoft Whiteboard): The fastest way to get a cross-functional team mapping together, in person or remotely. Miro has a dedicated journey map template that most teams can populate in a half-day workshop. All three are available to UK teams and comply with GDPR when configured correctly. Best for early-stage maps and workshop facilitation.
Diagramming tools (Lucidchart, Google Slides, PowerPoint): Good for producing a clean, shareable output after the workshop. Lucidchart’s journey map templates are particularly well-structured. Use these when the map needs to be presented to leadership or embedded in a strategy document.
CX platforms (Qualtrics, Medallia, Salesforce Marketing Cloud): These go beyond visualisation to stitch together real customer data across channels, score touchpoints automatically, and track journey performance over time. The trade-off is cost and implementation time. Relevant for enterprise teams with mature data infrastructure. UK teams should verify that data residency options meet ICO requirements before committing.
Research and insight tools (Hotjar, FullStory, Typeform, Intercom): These feed the map rather than build it. Session recordings from Hotjar or FullStory give you behavioural evidence for the emotions row. Typeform surveys can capture CSAT at specific touchpoints. Intercom’s conversation data is a goldmine for pain point identification.
When selecting any tool that processes customer data, UK teams need to confirm GDPR compliance, data residency (ideally UK or EU), and whether the vendor has a Data Processing Agreement available. More on this in the data privacy section below.
For most SMEs and marketing teams, starting with Miro or Google Slides and moving to a CX platform only when the map is proven and funded is the pragmatic path. Simple templates reduce setup time, and platform choice should follow data maturity, not precede it.
How do you know if your journey map is working?
The map itself is not the output. The interventions it triggers are. Measuring success means tracking whether those interventions moved the metrics tied to each stage.
| Journey stage | Primary KPIs | Secondary signals |
|---|---|---|
| Awareness | Organic traffic, share of voice, brand search volume | Social reach, PR mentions |
| Consideration | Time on page, content engagement, demo requests | Email open rates, return visits |
| Decision | Conversion rate, quote-to-close rate, trial activation | Objection frequency in sales calls |
| Retention | Churn rate, product adoption, support ticket volume | Onboarding completion rate |
| Advocacy | NPS, referral rate, review volume | Community participation, case study uptake |
Measurement checklist
- Set a baseline for each KPI before making any changes
- Run A/B tests on specific touchpoint changes where possible (landing page copy, email sequence, onboarding flow)
- Distinguish between leading indicators (engagement, activation) and lagging indicators (LTV, churn)
- Quantify emotional improvements using CSAT scores at specific touchpoints, not just overall satisfaction
- Review the map and its metrics quarterly, not annually
For practical guidance on connecting journey map work to ROI, marketing analytics frameworks give a useful structure for attribution and reporting.
Pro Tip: To quantify emotional improvements without a large research budget, add a single-question CSAT survey immediately after two or three key touchpoints (post-purchase confirmation, end of onboarding call, first support interaction). The score gap between touchpoints tells you exactly where the emotional dip is happening.
Common mistakes that kill journey maps, and how to avoid them
Most journey maps fail not because the research was bad, but because of how the map was built, presented, or (more often) not maintained. Here are the patterns worth avoiding.
Do not:
- Map every persona at once. Start with one, prove the value, then expand.
- Use internal workflow stages as your map’s structure (“lead generation”, “pipeline stage 2”). These describe what your teams do, not what the customer experiences.
- Treat the workshop as the endpoint. The map is a starting point for action, not a deliverable in itself.
- Fill the emotions row with assumptions. If you have not spoken to customers, label those cells as hypotheses and validate them.
- Build a map without assigning owners. A map with no named accountable person will not survive its first quarterly review.
Do:
- Tie the map to a specific, measurable objective from day one
- Use real customer quotes in the emotions row wherever possible
- Map both current and future states so the team can see the gap they are closing
- Present the map in the format your audience will actually use (a Miro board for a working team, a two-slide summary for a board)
- Schedule a review date before you leave the workshop
Pro Tip: The single best way to make a journey map “sticky” inside an organisation is to give it a home. Pin it to a shared Confluence page, a Notion workspace, or a physical wall in the office. Maps that live in a slide deck someone emailed once get forgotten within a month. Maps that are visible and referenced in team meetings become part of how the organisation thinks.
A UK example: how AMW Media applied journey mapping for a client
A UK-based professional services firm approached AMW Media with a specific problem: their website was generating enquiries, but a high proportion of those enquiries were not converting to paid engagements. The sales team believed the issue was pricing. The marketing team believed it was lead quality. Neither had mapped what actually happened between an initial enquiry and a signed contract.
The brief: map the consideration-to-decision journey for a mid-market buyer persona to identify where and why prospects were dropping out.
The process AMW Media ran:
- Stakeholder interviews with the sales and marketing teams to surface assumptions and existing data
- Six customer interviews with recent buyers and three with prospects who had not converted
- Review of CRM data, email open rates, and proposal acceptance rates
- A half-day synthesis workshop to build the current-state map and score opportunities
What the map revealed:
- The biggest drop-off happened between the proposal sent and the follow-up call, a gap of five to nine days with no structured touchpoint
- Prospects consistently reported feeling uncertain about implementation timelines, a question the proposal did not answer
- The sales team’s follow-up email was generic and did not reference the specific pain points discussed in the discovery call
Interventions prioritised:
- A structured three-touch follow-up sequence triggered by proposal send, with content addressing implementation timelines
- A revised proposal template that included a “what happens next” section
- A short case study PDF sent at day three of the follow-up sequence
The client reported a meaningful improvement in proposal-to-close rate within the first quarter after implementation. Support volume related to “what does onboarding look like?” queries also dropped, as the new proposal template answered that question proactively. These outcomes are reported as client-attributed results from the engagement.
UK data privacy and legal considerations when collecting customer data
Collecting customer data for journey mapping in the UK means operating under the UK GDPR and the Data Protection Act 2018, both enforced by the Information Commissioner’s Office (ICO). This is not a box-ticking exercise. Getting it wrong can invalidate your research and expose the business to regulatory risk.
The key principles that apply directly to mapping research:
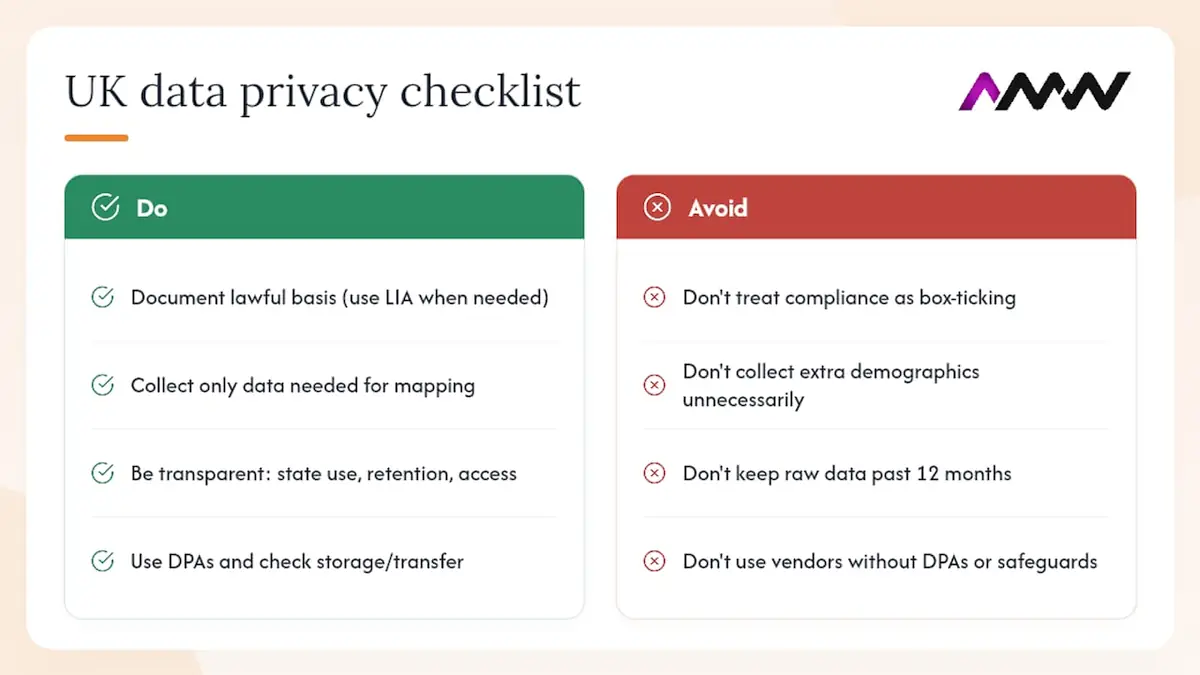
Lawful basis for processing: if you are conducting customer interviews, sending surveys, or analysing behavioural data, you need a lawful basis. For research involving existing customers, legitimate interests often applies, but you must document a Legitimate Interests Assessment (LIA). For cold outreach to prospects, consent is typically required.
Data minimisation: collect only what you need for the mapping objective. If your journey map does not require demographic data beyond job title and company size, do not collect it.
Transparency: tell participants what their data will be used for, how long it will be retained, and who will have access to it. This applies to interview recordings, survey responses, and analytics data tied to identifiable individuals.
Session recordings and analytics: tools like Hotjar and FullStory capture behavioural data that may constitute personal data under UK GDPR if it can be linked to an individual. Ensure your privacy notice covers this, and configure these tools to mask sensitive fields (form inputs, payment details) by default.
Data retention: set a retention period for interview recordings, transcripts, and survey responses. Most mapping projects do not need raw data beyond 12 months after the map is published.
Third-party tools: any tool that processes customer data on your behalf is a data processor. You need a Data Processing Agreement (DPA) in place with each vendor. Check that data is stored in the UK or EU, or that appropriate transfer mechanisms are in place if it is stored elsewhere.
The ICO’s guidance on research and statistics is the authoritative reference for UK teams. When in doubt, a brief review with a data protection adviser before launching primary research is a worthwhile investment.
When journey mapping is worth it, and when it is not
There is a version of this conversation that nobody writes about: the situations where a full journey mapping exercise is the wrong call.
Mapping delivers the most value when there is a meaningful, measurable problem to solve and enough organisational will to act on the findings. A product relaunch, a significant churn spike, a major channel shift (moving from field sales to digital self-serve, for example), or a post-merger service integration: these are the moments where the investment in research, workshops, and visualisation pays back quickly. The map gives everyone a shared language and a shared picture of the problem, which cuts the time it takes to align on solutions.
Where it tends to underdeliver: when the objective is vague (“we want to understand our customers better”), when there is no budget or authority to act on findings, or when the organisation already knows what the problem is and just needs to fix it. In those cases, a targeted experiment or a micro-map covering a single touchpoint will get you to an answer faster and with less overhead.
The other thing worth saying plainly: a journey map is not a one-time project. The most useful maps are living documents, updated when the product changes, when new research comes in, or when the metrics signal that a stage is underperforming. Treating the map as a quarterly artefact rather than an annual deliverable is what separates teams that get sustained value from those who file it away after the launch presentation.
If you are weighing journey mapping against other marketing innovation investments, the honest test is this: do you have a specific customer problem, a team willing to act on findings, and a metric you can move? If yes, map it. If not, start with the problem definition first.
AMW Media can handle the mapping work for you
If the process above sounds like the right approach but your team does not have the bandwidth to run it, AMW Media does this work for UK brands as part of its digital marketing and UX practice. Our Aylesbury page covers the trade buyer, who wants to see the product used properly before switching supplier.
A typical engagement starts with a short discovery session to agree the journey scope and objective, followed by a research sprint (customer interviews, analytics review, CRM analysis), a synthesis workshop, and a prioritised action plan. From there, AMW Media’s team can implement the fixes directly: web design and conversion improvements, PPC campaign refinements tied to specific awareness and consideration touchpoints, SEO content to close gaps in the research and evaluation stages, and automation to orchestrate follow-up sequences the map identifies as missing. The whole engagement is scoped to your budget and phased so you see results before committing to the full programme. Get in touch at AMW Media to discuss your specific journey and what a first sprint would look like.
Sources
- How to create customer journey maps in 2026 (+ templates) | Zendesk
- Journey mapping 101 | Nielsen Norman Group
- How to create a customer journey map: step-by-step guide | Smaply
- How to create a customer journey map | Lucidchart
FAQ
What is customer journey mapping?
Customer journey mapping is the process of visualising every step a customer takes with a brand, from first awareness through to advocacy, capturing their actions, emotions, and pain points at each stage. The goal is to identify friction and opportunities so teams can improve the experience in a targeted, evidence-backed way.
What are the five phases of a customer journey map?
The five core stages are awareness, consideration, decision, retention, and advocacy. Most practical maps use five to seven stages in total, with the exact number depending on whether the map is strategic or operational in scope.
How do you build a customer journey map step by step?
Set a clear objective and scope, pick one persona, gather qualitative and quantitative research, map stages and touchpoints, add emotions backed by evidence, score opportunities by impact and effort, assign owners with deadlines, then visualise and schedule quarterly reviews. The full process typically takes two to six weeks for a research-grounded map.
How many customer interviews do you need for a journey map?
For qualitative research on a single journey, five to eight interviews with customers who have recently completed that journey tends to be enough to reach saturation on the main themes. Fewer than five risks missing important patterns; more than twelve rarely adds proportional insight for a focused mapping project.
Can AMW Media help with journey mapping?
Yes. AMW Media runs discovery sessions, research sprints, and synthesis workshops for UK brands, and can implement the fixes the map identifies across web design, PPC, SEO, and marketing automation. Contact AMW Media at AMW Media to discuss scope and budget.
Recommended
- The role of UX in marketing: a practical guide | AMW Media
- What is brand engagement? A practical guide for marketers | AMW Media
- Creative campaign process: Step-by-step guide for growth | AMW Media
- Essential digital marketing guide: strategies for brand growth
Our free marketing audit looks at your site, your ads and your content, and comes back with a 30 day plan. No pitch deck.

Runs the business alongside Amir: contracts, onboarding and making sure every client knows what is happening and when. Meet the team.