
 Black Steel Doors
 Woodstock Campers
 Phillips Joinery
TL;DR:
- Most content teams produce more content than ever but fail to connect their output to what truly works through reliable analytics. Analytics shift from optional to essential by providing predictive insights, operational metrics, and feedback loops to optimise content strategy and efficiency. Embedding analytics into workflows enhances decision-making, reduces wasted effort, and ultimately drives better results from content initiatives.
Most content teams are producing more content than ever before and getting less from it than they should. The real issue is not output volume. It’s the absence of a reliable feedback loop connecting what gets made to what actually works. The role of analytics in content production has shifted from an optional extra to the central mechanism that separates high-performing teams from busy ones. If your content calendar is full but your results feel flat, analytics is not just helpful. It’s the thing that changes everything.
Key takeaways
| Point | Details |
|---|---|
| Analytics goes beyond counting | Tracking pageviews alone misses the context needed to make smarter production decisions. |
| Search Console and GA4 serve different purposes | Use both tools together for a complete picture of visibility and on-site behaviour. |
| Operational metrics matter too | Tracking time-to-publish and asset reuse alongside performance data improves workflow efficiency. |
| Content intelligence predicts, not just reports | AI-powered platforms can tell you what to create next, not just what performed well last month. |
| Feedback loops are the real prize | Embedding analytics directly into editorial workflows turns insights into continuous improvement. |
The role of analytics in content production
Content analytics, at its simplest, is the measurement and analysis of how your content performs across channels, formats, and audience segments. But there is a meaningful difference between basic analytics and what is increasingly called content intelligence, and conflating the two is one of the most common mistakes marketing teams make.
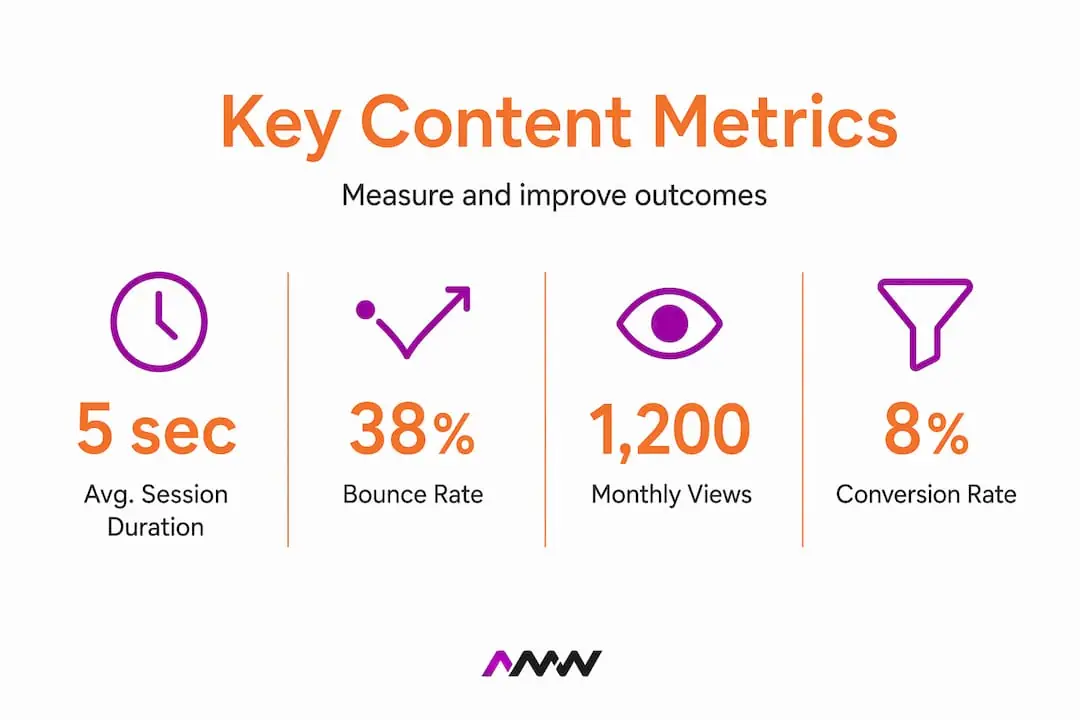
Basic analytics gives you numbers: pageviews, impressions, session duration, bounce rate. These are useful starting points, but they describe what happened without telling you why it happened or what you should do next. Content intelligence goes further. It uses predictive and prescriptive insights to help teams prioritise what to create next rather than simply reporting on outcomes after the fact.
Think of it this way. A basic analytics report tells you that a particular blog post had 4,000 views last month. A content intelligence platform tells you that long-form guides on a specific topic consistently convert at three times the rate of your news-style posts, and that you have a significant gap in coverage for a cluster of queries your audience is actively searching.
The metrics that sit at the foundation of content analytics include:
- Impressions and click-through rate (CTR): How often your content appears in search results and how frequently people choose to click it.
- Engagement rate: Time on page, scroll depth, video watch time, and interaction signals that show whether content is holding attention.
- Conversion events: Form fills, downloads, purchases, or any defined action that connects content consumption to business outcomes.
- Content decay indicators: Gradual drops in traffic or rankings that signal a piece needs updating rather than replacing.
The problem is not a lack of data. Most marketing teams are swimming in it. The problem is understanding context and outcomes rather than just counting engagement. A piece with low pageviews but a 12% conversion rate is more valuable than one with 10,000 views and zero conversions. Analytics helps you see that distinction.
Pro Tip: Set up a simple content performance matrix that scores each piece on both traffic and conversion impact. This two-axis view immediately surfaces your highest-value content and your biggest missed opportunities.
Tools and data sources that power content analytics
Understanding the tools available to you is not just a technical exercise. It directly shapes the quality of decisions your content team can make.
| Tool | What it measures | What it misses |
|---|---|---|
| Google Search Console | Impressions, CTR, average position, query data | On-site behaviour after the click |
| Google Analytics 4 (GA4) | User behaviour, sessions, conversions, engagement | Pre-click search visibility signals |
| Content intelligence platforms | Predictive scoring, content gaps, asset-level ROI | Real-time crawl data and technical SEO signals |
| Social analytics tools | Reach, shares, saves, audience demographics | Search intent and long-tail query performance |
Search Console is where your analytics workflow should begin. It tells you which queries are driving impressions and clicks, which pages have seen shifts in visibility, and where your content is appearing without converting searchers. GA4 then picks up the story after the click, measuring user behaviour and conversions once someone lands on your site.

The real power comes from connecting both. Linking GA4 to Search Console brings search dimensions inside your GA4 reports, so you can see which organic queries drove the visitors who converted, rather than only that a page had high engagement. That is a fundamentally different level of insight.
Beyond these two staples, a growing category of content intelligence platforms analyses performance at the asset level. Adobe’s Content Analytics, for example, can analyse image and attribute-level data tied to engagement and conversion metrics, so you understand which creative elements within a page drive results, and not only which pages perform well.
Pro Tip: Do not try to force Search Console and GA4 metrics to match each other. They measure different things and their numbers will legitimately diverge. Keeping separate perspectives for search visibility and on-site engagement leads to clearer, more useful insights rather than confusion.
How analytics improves content strategy and efficiency
This is where the rubber meets the road. Knowing how analytics works is one thing. Using it to make your content production smarter is another.
Here is how a well-integrated analytics workflow actually changes how teams operate:
Prioritise your content backlog using predictive scoring. Most teams have a backlog of content ideas that gets ordered by whoever shouted loudest in the last planning meeting. Analytics changes this. Predictive scoring analyses signals across your content ecosystem to rank ideas by likely impact on qualified traffic and conversion, not by gut feel. You make fewer pieces, but better ones.
Identify your highest-converting formats and topics. Not all formats work equally well for every audience or objective. Analytics tells you whether your audience converts better from long-form guides, short videos, or comparison pages. Once you know this, you stop wasting budget on formats that look impressive but do not shift the numbers.
Track operational metrics alongside performance data. Integrating analytics into content workflows means tracking time-to-publish and asset reuse rates alongside traffic and conversion data. This reveals whether your production process itself is a bottleneck. A brilliant content idea that takes six weeks to produce is often less valuable than a good idea that ships in one.
Create genuine feedback loops between data and creative teams. The most common failure point in data-driven content is when analytics lives in one department and creative decisions happen in another. Embedding analytics into authoring and approval workflows creates real-time feedback so writers, designers, and strategists are all working from the same performance picture.
Use data to inform audience segmentation in production. Analytics reveals which content resonates with which audience segments, not just in aggregate. This allows you to build a production mix that serves different buyer stages rather than producing everything for an imagined average reader.
Pro Tip: Run a quarterly content audit using both Search Console and GA4 data. Look for pieces with high impressions but low CTR (a title or meta description problem) separately from pieces with high traffic but low conversion (a content relevance or offer problem). These require completely different fixes.
Using analytics for content optimisation
Getting content live is not the end of the job. It is closer to the beginning. The brands that consistently outperform their competitors treat every published piece as an asset to be optimised over time, not a task to be checked off.
The metrics that matter most for optimisation are not the vanity numbers. Pageviews feel good but they tell you very little on their own. The metrics that indicate content health include conversion rate by content type, lead quality from organic traffic (not just volume), and where specific pieces sit in the customer journey. A piece that generates hundreds of top-of-funnel reads but contributes to zero sales conversations needs a different kind of attention than one that drives qualified enquiries from a narrow audience.
Asset-level analysis is particularly underused. Most teams measure at the page level, but analytics platforms can surface which creative attributes within a page drive engagement and conversion. Does adding a specific type of image above the fold increase scroll depth? Does a particular call-to-action placement correlate with higher form fills? These are answerable questions when you have the right data.
Content gap analysis is another area where analytics earns its keep. By combining Search Console query data with your existing content inventory, you can identify topics your audience is searching for that you have not yet addressed. This is one of the most reliable ways to boost SEO visibility and traffic without guessing what to write next.
Key areas where analytics directly shapes optimisation decisions:
- Updating decaying content: Traffic drops on a once-strong piece are a signal, not a sentence. Analytics identifies exactly which queries are losing ground so you can refresh the content strategically rather than scrapping it.
- Personalisation at scale: Engagement data combined with behavioural signals helps you identify which content sequences lead to conversion, informing smarter nurture and retargeting strategies.
- Format experimentation: If your analytics show that video embeds on long-form pages increase time on page by 40%, that is a production decision, not just a design preference.
- Distribution timing: Engagement data across channels tells you when your specific audience is most active, which is often quite different from generic industry benchmarks.
Common challenges in applying analytics
Even with the best tools available, most teams run into predictable problems when they try to put analytics at the centre of content production. Knowing these pitfalls in advance saves a considerable amount of time and frustration.
Conflating Search Console and GA4 metrics. These tools answer different questions and their numbers should not be forced to match. Treating them as equivalent leads to reporting confusion and poor decisions. Use Search Console to diagnose search visibility changes, then use GA4 to understand what happened to engagement and conversions on those pages after the fact.
Chasing vanity metrics. Impressions and follower counts are not meaningless, but they become misleading when they replace conversion and engagement metrics as the primary measure of success. If your monthly report is mostly pageviews and social reach, your strategy is probably optimised for the wrong things.
Analytics living in a silo. Data that sits in a dashboard nobody checks is not analytics. It is decoration. The impact of data on content only materialises when insights are actively connected to production decisions. This requires clear ownership, regular review cadences, and a team culture that treats data as part of the creative process.
Starting without clear KPIs. Measuring everything without defining what success looks like leads to analysis paralysis. Start with two or three KPIs that directly connect content performance to business outcomes, then build from there.
Ignoring operational data. Teams that only measure content performance and not production efficiency miss half the picture. Analytics-driven workflow improvement includes understanding how long it takes to produce, approve, and publish content, and whether your asset library is being used effectively.
My honest take on analytics and creativity
I’ve worked alongside content teams at many different stages of their analytics maturity, and the pattern I keep seeing is the same. The teams that struggle are not the ones with bad data. They’re the ones that treat analytics as a post-production report card rather than a creative input.
I’ve seen brands invest heavily in content volume, particularly with the rise of AI-assisted writing, and end up with a catalogue of pieces that ranks for nothing, converts nobody, and accumulates like digital clutter. Without analytics explaining why performance differs, more content just means more noise.
What I’ve found changes things is when analytics gets embedded into the brief rather than bolted on afterwards. When a writer knows before they start that a particular topic cluster consistently drives qualified leads, that a certain format outperforms others for their audience, and that there is a specific gap in coverage their team has not yet addressed, the quality of output improves. Not because they are constrained by data, but because they are better informed.
Analytics driving ROI is not automatic. It requires someone willing to interpret the data, connect it to creative decisions, and build the habit of asking “what does the data suggest?” before “what should we write?” That shift in mindset is harder than setting up GA4. But it is the thing that actually works.
Amir
Put your content data to work with AMW Media
If this article has you thinking about how to make analytics work harder inside your own content production process, AMW Media can help you move from insight to execution. Our marketing agency Reading page asks the question that follows from all of this: what should small business marketing actually earn?
At AMW Media, we work with ambitious brands to build data-driven content strategies that connect creative output to measurable results. Whether you need SEO services that turn search performance data into a smarter content plan, or social media management that uses engagement analytics to improve what gets made and when, our team brings both the strategic thinking and the creative capability to make it real. We do not just track numbers. We use them to make better content decisions, consistently.
FAQ
What is the role of analytics in content production?
Analytics in content production helps teams understand which content performs, why it performs, and what to create next. It moves decision-making from opinion to evidence, connecting content output directly to audience behaviour and business outcomes.
How do Search Console and GA4 work together?
Search Console measures search visibility, impressions, and click-through rates, while GA4 tracks on-site behaviour and conversions after a click. Used together, they provide a complete picture from search intent through to conversion, making content optimisation far more precise.
What is content intelligence and how does it differ from basic analytics?
Content intelligence uses AI-powered predictive and prescriptive analysis to tell you what to create next and where the gaps are, rather than simply reporting what happened. Basic analytics counts metrics; content intelligence interprets them and recommends action.
How do I know which content metrics actually matter?
Focus on metrics that connect content performance to business outcomes: conversion rate by content type, lead quality from organic traffic, and customer journey contribution. Pageviews and impressions are useful context, but should not be your primary success measures.
How can analytics help reduce wasted content production effort?
By identifying your highest-converting formats, tracking content decay, and using predictive scoring to prioritise your backlog, analytics ensures your production time goes to content with the highest likelihood of delivering results rather than filling a calendar.
Recommended
- Effective content production strategies for brand growth
- The role of AI in content creation for ambitious brands | AMW Media
- The role of digital content in brand growth and engagement
- How marketing analytics truly drives ROI for brands | AMW Media
Our SEO manager runs the technical checks by hand, looks at who is beating you, and sends back the order to fix it in. Free, and you keep it either way.

On site with the cameras most days of the week. Installs, interviews, products and events, from London to Liverpool. Meet the team.