
 Black Steel Doors
 Woodstock Campers
 Phillips Joinery
If your site feels sluggish, start by running PageSpeed Insights and a WebPageTest check on your slowest page, then note the Largest Contentful Paint, Time to First Byte and top flagged issues. In most cases, the culprits are oversized images, heavy third-party scripts or slow hosting. Small, targeted fixes in these three areas often produce a noticeably faster-feeling site within days.
TL;DR:
- Most site slowdowns stem from unoptimized images, third-party scripts, and slow hosting, with fixing these often producing quick visible improvements.
- Running PageSpeed Insights and WebPageTest on your slowest pages provides specific metrics and flags to guide targeted fixes.
- Prioritize compressing images, deferring non-essential scripts, enabling compression, and improving hosting infrastructure for substantial speed gains.
- Small, mobile-specific optimizations like lazy loading and content prioritization significantly boost perceived performance and user engagement.
- Regularly measure 75th percentile LCP with real user data to verify improvements and ensure faster experiences translate into better conversions.
Table of Contents
- What typically slows a website down
- How to measure site speed before you change anything
- Prioritised fixes: quick wins through to infrastructure changes
- Mobile speed and perceived performance matter more than raw load time
- A practical view from auditing client sites
- How we can help if you’d rather hand this off
- FAQ
- Sources
What typically slows a website down
Before you touch anything, it helps to match what you’re seeing to what’s actually happening behind the scenes. A slow Largest Contentful Paint usually points to render-blocking resources or a sluggish server response. A high Time to First Byte points straight at hosting. Layout shift and long CPU tasks usually trace back to JavaScript or fonts loading in the wrong order.
Images and video are the most common offender. Uncompressed photos, the wrong file format (JPEG where WebP or AVIF would halve the size) and missing srcset attributes mean mobile visitors download desktop-sized files. Add missing lazy loading and you’re forcing browsers to fetch everything above and below the fold at once.
Third-party scripts and embeds are quieter killers. Chat widgets, ad tags, social embeds and analytics tools each add their own network requests, and they block rendering while they load. Web notes that even a single early connection can cost 100 to 500 milliseconds, and that deferring adverts or analytics tags often produces the biggest single improvement on a page.
CSS causes trouble in two ways: render-blocking stylesheets that the browser must download and parse before showing anything, and bloated frameworks carrying thousands of unused rules. The Government Digital Service moved GOV.UK from one large bundled stylesheet to page-specific CSS files and cut CSS size by up to 40% on some pages, with knock-on improvements to start render and LCP. Splitting styles by page or template reduces what each visitor downloads, though splitting too aggressively can create its own overhead from extra requests, so it’s worth testing either way.
JavaScript bundles grow the same way junk drawers do: nobody adds much at once, but it piles up. Single-page apps are particularly prone to shipping code for routes a visitor never touches.
Hosting and database queries matter more than most site owners assume. Shared hosting, an underpowered server or a database running unindexed queries all show up as a slow TTFB, and no amount of front-end optimisation fixes a backend that takes two seconds to respond before a single byte reaches the browser.
Caching and compression gaps are easy wins once you spot them: missing cache headers mean returning visitors re-download everything, and skipping Gzip or Brotli compression leaves text-based assets needlessly large.
Fonts and request count add up quietly too. Loading six weights of a typeface when you use two, or serving dozens of small icon files instead of a single sprite, multiplies HTTP requests for no visible benefit.
Common root causes to check first, roughly in order of frequency:
- Unoptimised images and video without responsive sizing or lazy loading.
- Third-party scripts (chat, ads, analytics, embeds) loading without delay.
- Render-blocking CSS and oversized, unused framework code.
- Large JavaScript bundles and long main-thread tasks.
- Slow hosting, weak server caching or unindexed database queries.
- Missing compression, weak cache headers and excessive font or icon requests.
Content-managed sites add a layer on top: plugin bloat, unoptimised database tables and query-heavy widgets can all quietly drag a WordPress or similar site down even when the front end looks lean.
How to measure site speed before you change anything
Guessing at fixes wastes time, so measure first. Lab tools like Lighthouse and PageSpeed Insights simulate a page load under controlled conditions, which makes them consistent and good for before-and-after comparisons, but they don’t reflect what a real visitor on a patchy 4G connection experiences. Field data, gathered through the Chrome User Experience Report (CrUX) or your own Real User Monitoring setup, captures how actual visitors experience your pages, including the slow tail that lab tests miss entirely.
PageSpeed Insights reports both: Lighthouse for lab data and CrUX for field data, and it scores pages against the Core Web Vitals thresholds (LCP at 2.5 seconds or under, INP at 200 milliseconds or under, CLS at 0.1 or under), assessed at the 75th percentile rather than the average. That 75th percentile detail matters: it means the metric reflects a typically slower visit, not your best-case load.
One figure worth tracking from day one: your site’s 75th percentile LCP, reported directly in PageSpeed Insights, tells you how your slower-than-average visitors experience the page rather than flattering you with a best-case number.
To run a quick audit:
- Open PageSpeed Insights, enter your page URL, and record the LCP, CLS, INP and TTFB figures.
- Run the same page through WebPageTest for a filmstrip view of what loads and when.
- Note the top three recommendations each tool flags, usually images, scripts or render-blocking resources.
- Repeat on your three or four highest-traffic pages, since homepages and landing pages often behave differently.
- Record a baseline for each metric so you can measure whether a fix actually worked.
For each page, it’s worth keeping a simple record of 75th percentile LCP, TTFB, total JavaScript execution time and the combined weight of third-party scripts. Those four numbers tell you more about real-world experience than a single overall score ever will.
Prioritised fixes: quick wins through to infrastructure changes
Fix in order of impact and effort, not in whatever order looks most interesting. Here’s a rough roadmap.
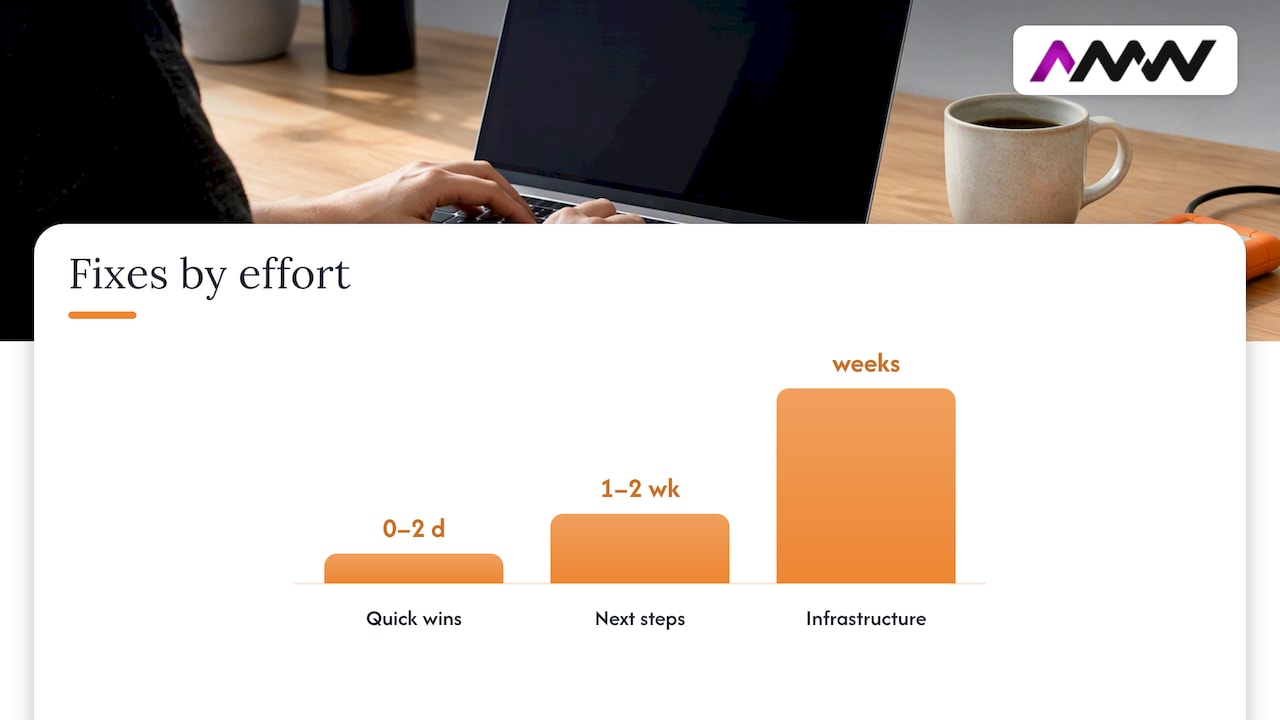
Quick wins (0 to 2 days):
- Compress and resize images, switch to WebP or AVIF, and add lazy loading for anything below the fold.
- Turn on Brotli or Gzip compression at the server level.
- Set strong cache headers so returning visitors aren’t re-downloading static assets.
- Remove or delay non-essential third-party scripts, particularly chat widgets and marketing pixels.
- Lazy load iframes and embeds rather than letting them load immediately.
Next steps (1 to 2 weeks):
- Extract and inline critical CSS for above-the-fold content, and load the rest asynchronously.
- Add
asyncordeferto script tags so they stop blocking rendering. - Introduce code-splitting and tree-shaking so pages only load the JavaScript they actually use.
- Set a sensible
font-displaystrategy (swap or optional) and cut unused font weights.
Infrastructure changes (weeks, not days):
- Move to better hosting or add a content delivery network to cut geographic latency for distant visitors.
- Enable HTTP/2 or HTTP/3, which allow multiplexed connections instead of one request at a time.
- Add server-side caching and fix slow or unindexed database queries.
- If a migration is on the table anyway, build performance checks into the plan from the start rather than retrofitting them, something our website migration SEO checklist covers in more detail.
Process and prevention:
The GDS Way treats performance as part of service design rather than a one-off clean-up, recommending a performance budget that’s checked throughout development. A budget (say, a hard limit on JavaScript weight or LCP time) forces trade-off conversations before a feature ships, rather than a post-launch scramble when the site slows down. Add performance checks to your CI/CD pipeline, and schedule a RUM review after each release rather than only when someone complains.
Pro Tip: Fix the one thing causing the biggest delay before touching five small ones, a single blocking script often costs more than a dozen unoptimised icons combined.
Expected gains vary by site, but the pattern tends to hold: deferring a heavy third-party script or compressing a hero image usually produces a bigger, more visible improvement than micro-optimising already-small files. If you want a structured starting point, our website optimisation checklist walks through the same priorities in more depth.
A mini roadmap for a typical small business site might look like: week one, compress images and defer scripts; week two, extract critical CSS and fix font loading; week three onward, address hosting and database issues if TTFB is still high.
Mobile speed and perceived performance matter more than raw load time
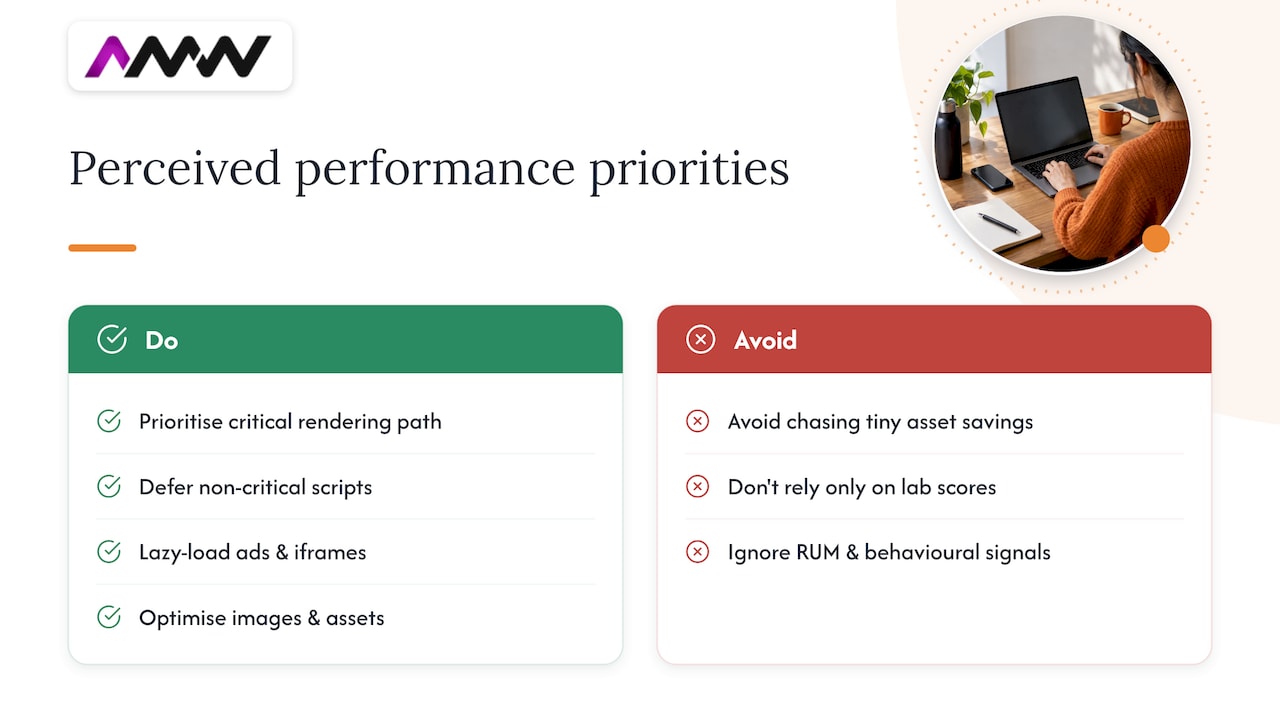
Visitors don’t experience a stopwatch, they experience whether the page feels responsive. That’s why prioritising the critical rendering path, getting meaningful content on screen fast and making the page interactive quickly, often matters more than shaving fractions of a second off total load time. A web.dev case study on mobile performance found that a handful of targeted changes, deferring scripts, lazy loading ads and iframes, and optimising images, produced outsized gains in both perceived speed and business outcomes compared with chasing smaller asset savings.
On low-end devices and patchy mobile networks, smaller JavaScript bundles and prioritised font and content loading matter even more, since there’s less processing headroom to hide inefficiency. Skeleton UIs and placeholder content can also make a page feel faster even before everything has fully loaded.
The only reliable way to confirm whether a change actually helped real visitors is to check RUM data alongside behavioural signals like bounce rate or conversion rate, since lab scores can improve while the experience that matters to your business stays flat. This matters doubly for PPC traffic, where a slow landing page can undo the cost of the click that brought the visitor there in the first place.
A practical view from auditing client sites
Most speed audits we run turn up the same three issues: unoptimised images, scripts loading before they’re needed, and hosting that was fine for a smaller site two years ago. The fix is rarely glamorous. Run the audit, fix what’s actually slowing the page down, measure again, and prioritise anything touching your highest-traffic or highest-converting pages first. Everything else can wait.
— Amir
How we can help if you’d rather hand this off
If a speed audit sounds like one more thing competing for your time, we run technical audits alongside web design and development and SEO services work, so performance fixes get built in rather than bolted on afterwards.

That’s worth considering if speed issues are already costing you conversions, or if nobody on your team has the time to chase down every render-blocking script. For server or hosting-level questions beyond our remit, we also work alongside IT partners such as CTA Systems I.T. Solutions for deeper infrastructure audits. Before a discovery call, it helps to have your analytics access ready, a couple of PageSpeed Insights screenshots, and a short list of the pages you care about most. You can browse our full services or get in touch to arrange a chat.
FAQ
Why is my website speed slow?
Slow speed usually comes down to oversized images, unoptimised third-party scripts, or hosting that can’t respond quickly enough. Running PageSpeed Insights on the affected page will usually point straight at the biggest offender.
Why is every website so slow now?
Pages have grown heavier over time as sites add more scripts, embeds, fonts and tracking tags, each adding its own loading cost. Web.dev’s guidance on third-party scripts notes that these additions are often the hidden reason pages feel slower even when the core content hasn’t changed.
What should I do if a website is running slowly?
Start by running a lab test such as PageSpeed Insights or WebPageTest to see what’s blocking the page, then fix the quickest wins first: compressing images, deferring non-essential scripts and enabling compression. Check field data too, since real visitor conditions can differ from a lab test.
How do I measure whether a fix actually worked?
Compare your baseline Core Web Vitals, particularly the 75th percentile LCP reported in PageSpeed Insights, before and after the change. Field data from real user monitoring confirms whether the improvement holds up for actual visitors, not just in a controlled test.
Does site speed really affect SEO and conversions?
Core Web Vitals form part of how Google assesses page experience, and slower pages tend to see weaker engagement. A web.dev case study found that mobile performance improvements were linked to measurable gains in both user behaviour and revenue.
Sources
- How we reduced CSS size and improved performance across GOV.UK
- The GDS Way — how to optimise frontend performance
- Web
- About PageSpeed Insights (PSI)
Recommended
- Website optimisation checklist: your 2026 UK guide
- Website design best practices: top 10 for better UX
- Fix Core Web Vitals Errors in 28 Days: Field First for UK Sites
Our free marketing audit looks at your site, your ads and your content, and comes back with a 30 day plan. No pitch deck.

Founded AMW Media in 2024 and runs strategy, paid media and the CRM builds. The reason everything here is in house and measured in revenue. Meet the team.